Education doing well in EU: 2020 goals already mostly met

Foto Pixabay
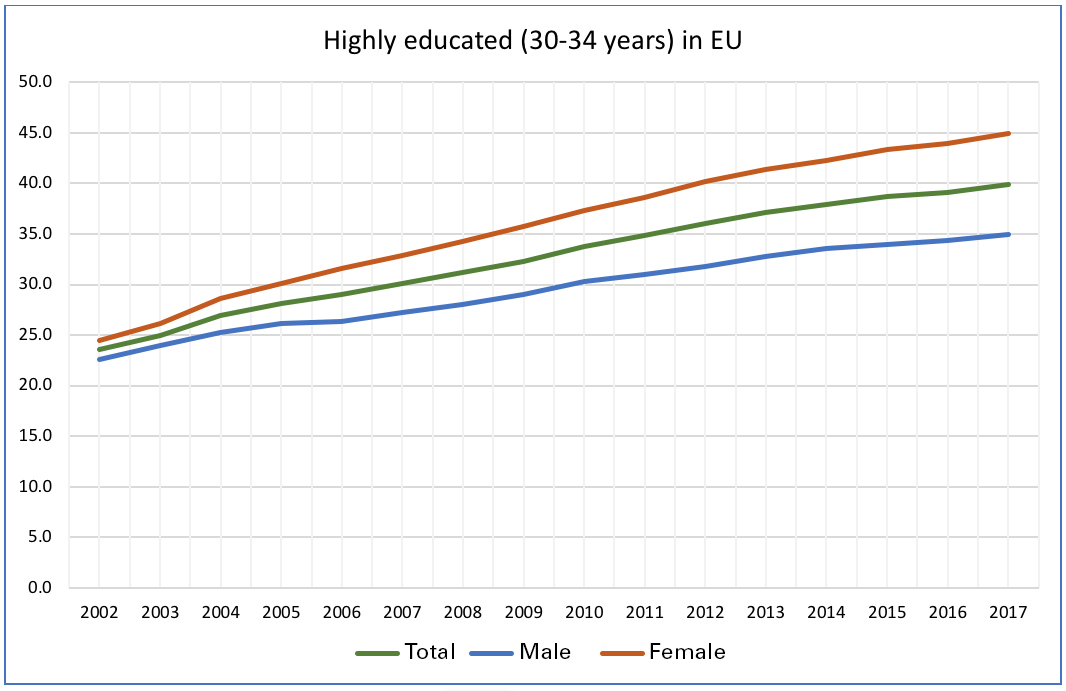
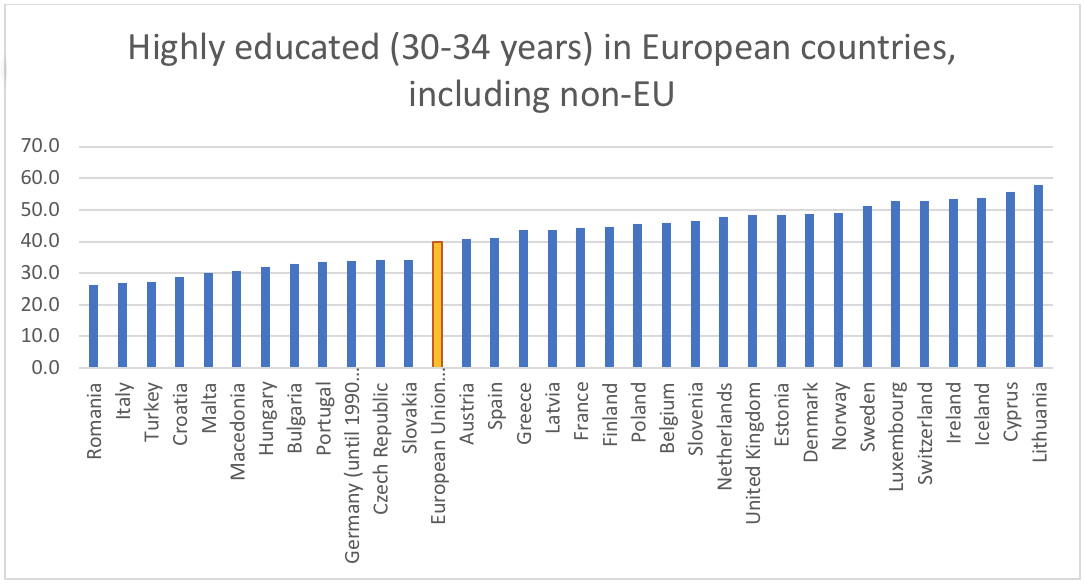
Fourty percent is the norm that the European countries decided on in 2010, in the midst of the economic crisis: they agreed they’d have ten years to reach that goal. And that looks doable, according to the European statistics bureau Eurostat. We’re basically there already.
For the Netherlands, the goal was easy to reach. The Dutch had already reached the 40 percent before 2010. By now, almost half of people in the Netherlands between thirty and 34 years old have a degree from a university or university of applied sciences.
© HOP. Bron: Eurostat.
Counting
Percentages aren’t everything. Lithuania and Cyprus are upwards of 55 percent, while Germany, the economic force of the European Union, is stuck around 34 percent. That’s a consequence of the definition of higher education. Some countries count studies that the Netherlands would classify as mbo – not higher education, but ‘middle’ – and in Germany, the opposite is true: studies such as nursing and physical therapy don’t count as higher education.
Women in Europe are doing better than men: or at least, they graduate from higher education more often. They were at 37.3 percent in 2010, and are now at 44.9 percent, well above the norm. In the meantime, men climbed from 30.3 percent to 34.9 percent: they were lagging behind in 2010, and the gap has only gotten bigger.
In the Netherlands, women are doing better than men, too. The men (30-34 years) went from 38.4 to 44 percent highly educated in the past ten years, while the women climbed from 44.4 to 51.8 percent.
In the lead
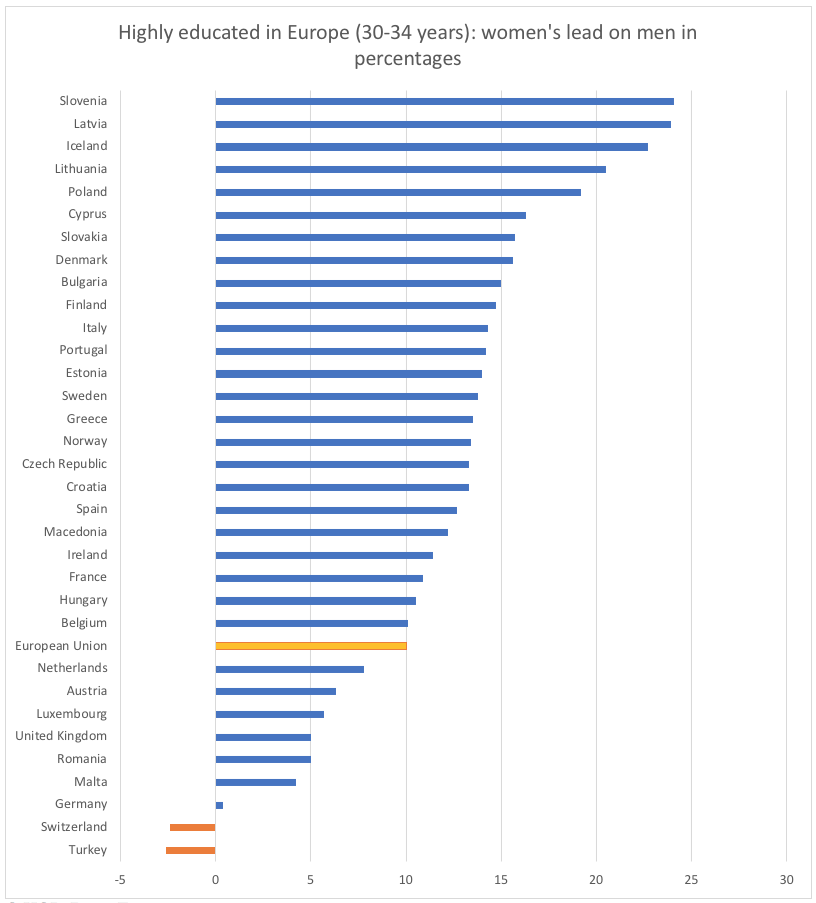
In some countries, such as Germany, the gap between women and men is very small. In two non-EU countries – Switzerland and Turkey – men are even ahead by a few percent.
But in other countries, women are overwhelmingly in the lead: in Slovenia, 59 percent of women in the 30-34 year age group holds a higher education degree, while only 35 percent of men does.
© HOP. Bron: Eurostat.
Female | Male | Difference | |
Turkey | 26,0 | 28,6 | -2,6 |
Switzerland | 51,6 | 54,0 | -2,4 |
Germany | 34,2 | 33,8 | 0,4 |
Malta | 32,2 | 28,0 | 4,2 |
Romania | 28,9 | 23,9 | 5,0 |
United Kingdom | 50,8 | 45,8 | 5,0 |
Luxembourg | 55,5 | 49,8 | 5,7 |
Austria | 44,0 | 37,7 | 6,3 |
Netherlands | 51,8 | 44,0 | 7,8 |
EU totaal | 44,9 | 34,9 | 10,0 |
Belgium | 50,9 | 40,8 | 10,1 |
Hungary | 37,5 | 27,0 | 10,5 |
France | 49,6 | 38,7 | 10,9 |
Ireland | 58,9 | 47,5 | 11,4 |
Macedonia | 36,8 | 24,6 | 12,2 |
Spain | 47,5 | 34,8 | 12,7 |
Croatia | 35,4 | 22,1 | 13,3 |
Czech Republic | 41,0 | 27,7 | 13,3 |
Norway | 55,9 | 42,5 | 13,4 |
Greece | 50,5 | 37,0 | 13,5 |
Sweden | 58,4 | 44,6 | 13,8 |
Estonia | 55,6 | 41,6 | 14,0 |
Portugal | 40,4 | 26,2 | 14,2 |
Italy | 34,1 | 19,8 | 14,3 |
Finland | 52,0 | 37,3 | 14,7 |
Bulgaria | 40,5 | 25,5 | 15,0 |
Denmark | 56,7 | 41,1 | 15,6 |
Slovakia | 42,4 | 26,7 | 15,7 |
Cyprus | 63,5 | 47,2 | 16,3 |
Poland | 55,5 | 36,3 | 19,2 |
Lithuania | 68,1 | 47,6 | 20,5 |
Iceland | 65,7 | 43,0 | 22,7 |
Latvia | 56,0 | 32,1 | 23,9 |
Slovenia | 58,8 | 34,7 | 24,1 |
© HOP. Bron: Eurostat.
© HOP. Bron: Eurostat.