Housing shortage for Utrecht students halved by 2026

Creative commons: pixabay. Tabellen en grafieken: DUB
Minister of Housing, Kajsa Ollongren, had commissioned research agency ABF-Research to map (In Dutch, ed.) the student housing market in the twenty largest college cities. The agency also studied how the market will develop up to the year 2026.
Number of student housing units will increase In the study, the researchers distinguish between structural and flexible housing. Structural housing consists of homes that have (largely) housed student for many years. This includes not just SSH student housing units, but also association houses, and apartments bought by parents for their college-aged children. Available flexible housing isn’t exclusively on offer to students, as graduates and singles also make use of this. That means students have to compete with people looking for housing who aren’t in college.
Structural housing currently comprises around 35 percent of the total number of ‘student housing units’ on offer in the Netherlands, and is expected to grow relatively faster than before: with an annual 1.3 percent instead of 0.5 percent. This is partially due to municipalities’ many new construction plans. The past few years, municipalities had been reluctant to construct new student housing as a result of the economic crisis and the expected decrease in numbers of students leaving home to live independently.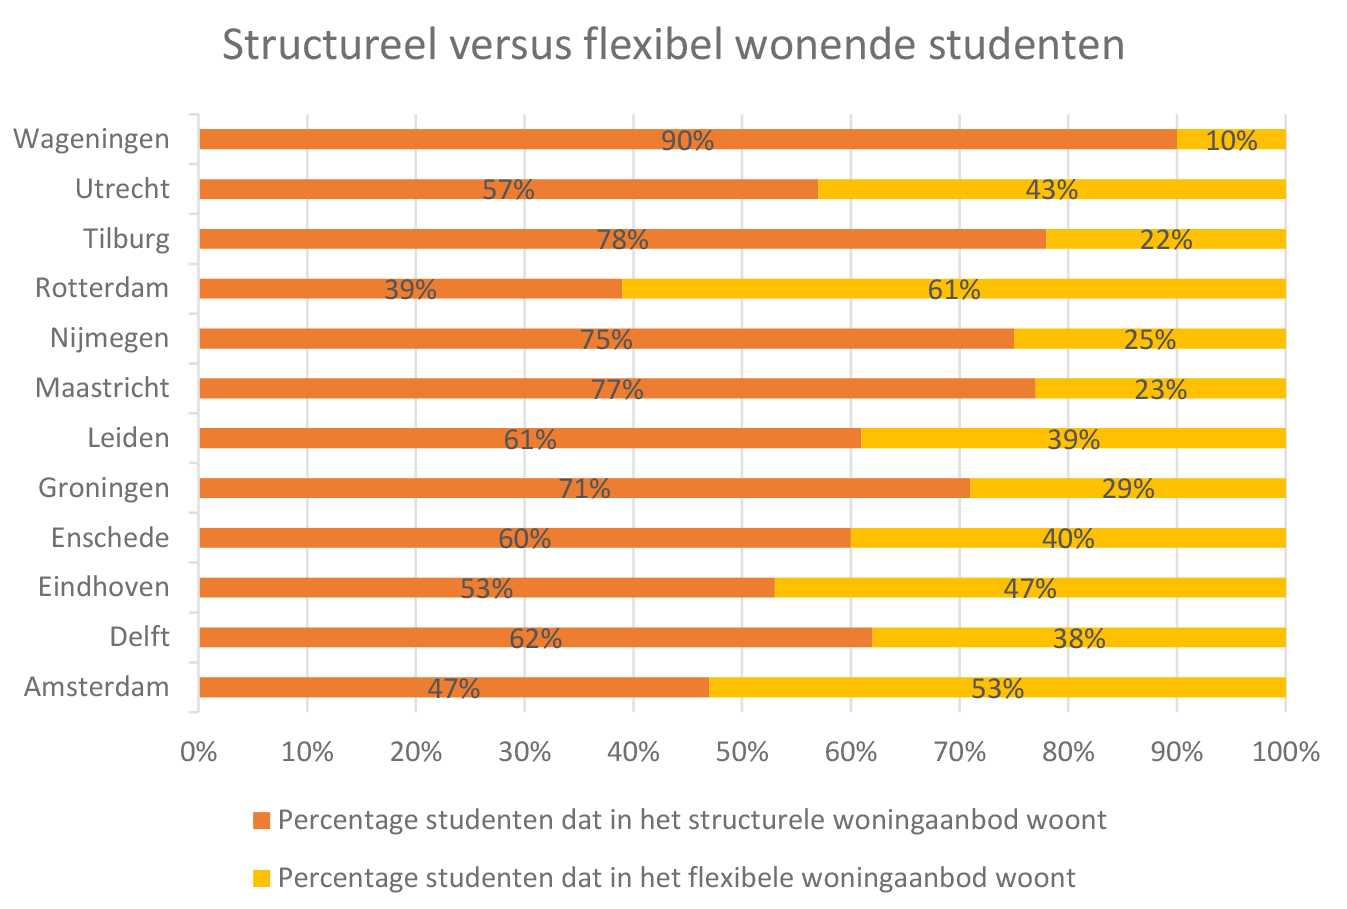
Students living in structural vs flexible housing
The graph above shows for each university city the percentage of students in structural (orange) and flexible housing (yellow) in academic year ’17-’18. Source: ABF report ‘Student Housing’. Illustration: DUB
The graph above shows for each university city the percentage of students in structural (orange) and flexible housing (yellow) in academic year ’17-’18. Source: ABF report ‘Student Housing’. Illustration: DUB
In the college cities where the housing shortages were the most dire in 2017-2018 (Amsterdam, Utrecht, and Rotterdam), a relatively small percentage of students live in structural housing compared to other cities.
Students looking for housing in a city with a low availability of structural housing, more often (have to) choose housing that wasn’t specifically developed for students. This means having to compete with other groups of residence seekers, and often have to pay more money for fewer square metres.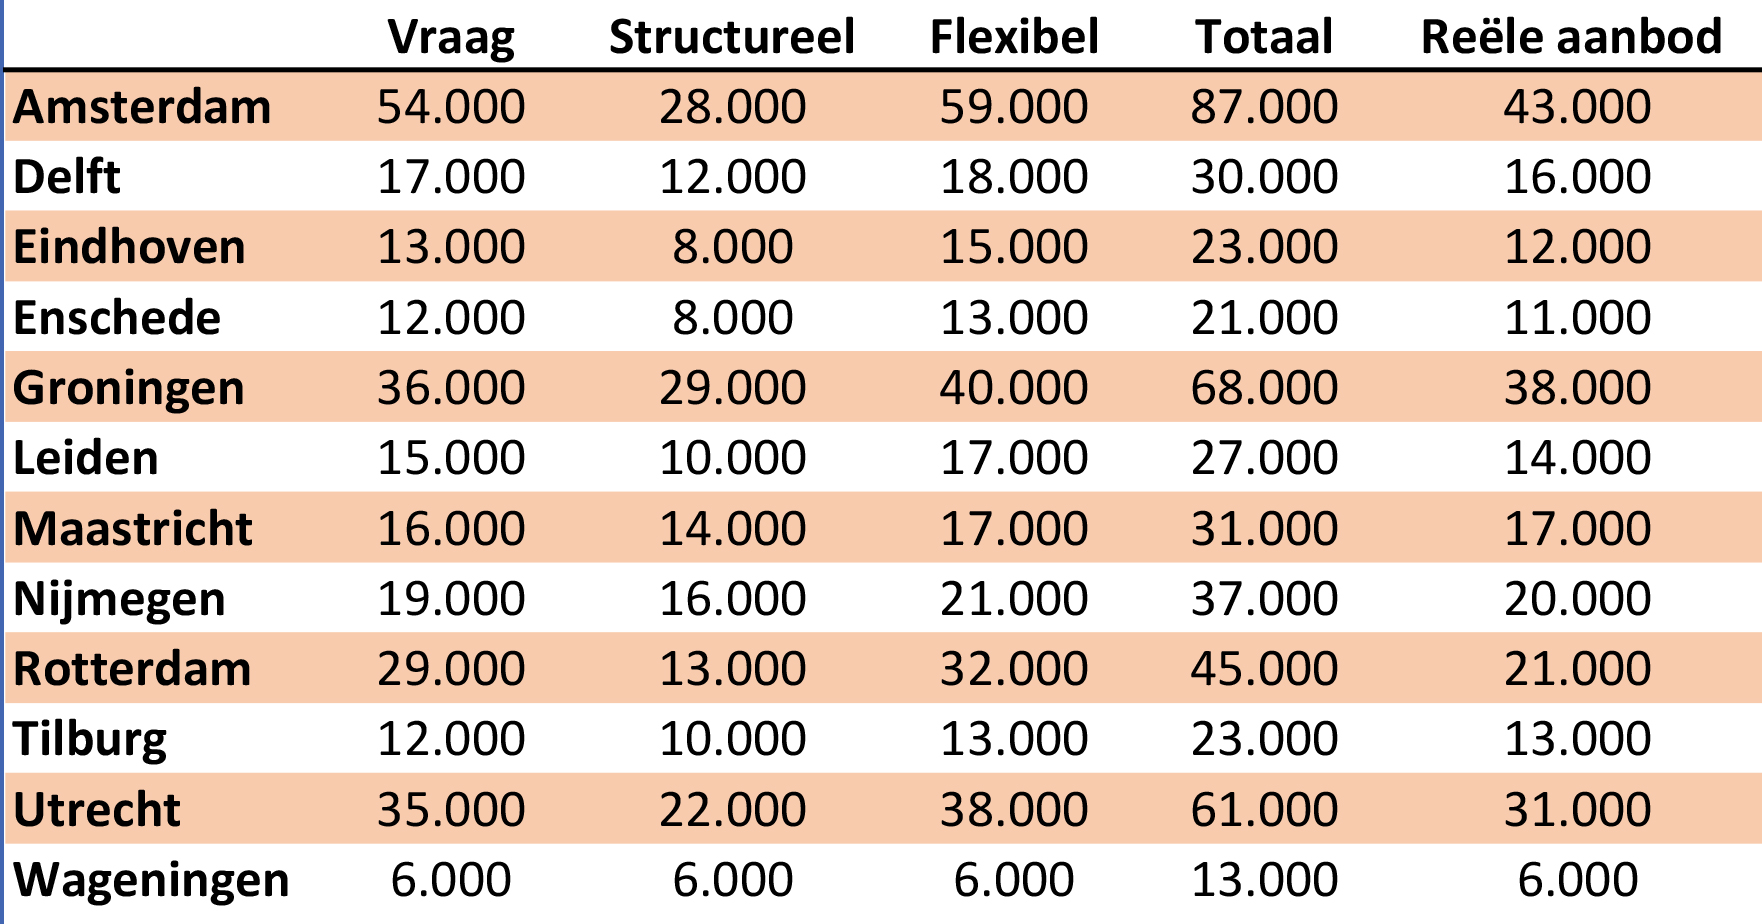
The table above shows the following for each university city: the demand for student housing, the size of the structural housing market, how many flexible homes are offered, how many potential student housing units there are in total, and the realistic availability of student housing units. The difference between the total and the realistic numbers is a result of the fact that flexible rooms are not exclusively available to students. The numbers in this graph were rounded to the nearest thousand. Source: ABF report ‘Student housing’.
In order to satisfy the demand, more structural housing is needed. That way, students won’t resort to flexible housing as quickly. the researchers say the housing market is ‘balanced’ when the structural housing is inhabited by students for around 90 percent, and the flexible housing for a maximum of 30 percent.
Utrecht succeeds in relieving housing shortage Based on municipalities’ plans for construction and demolition, as well as people turning homes into student housing units or the other way around, the number of structural housing units relative to the demand will increase by 11% by 2025-2026. The fastest growth is expected in Leeuwarden, Haarlem, The Hague, and Leiden, with Wageningen (36 percent) as outlier.
In six of the twelve university cities, the housing market will be ‘balanced’ by 2026; there will be sufficient rooms available to meet the market demand. Of the three cities that currently struggle most with housing shortages, Utrecht is the only one of which researchers expect it will succeed in reducing the shortage of structural student housing units: from 4,000 to 2,000. In Amsterdam, Delft, and Eindhoven, the shortages are expected to increase.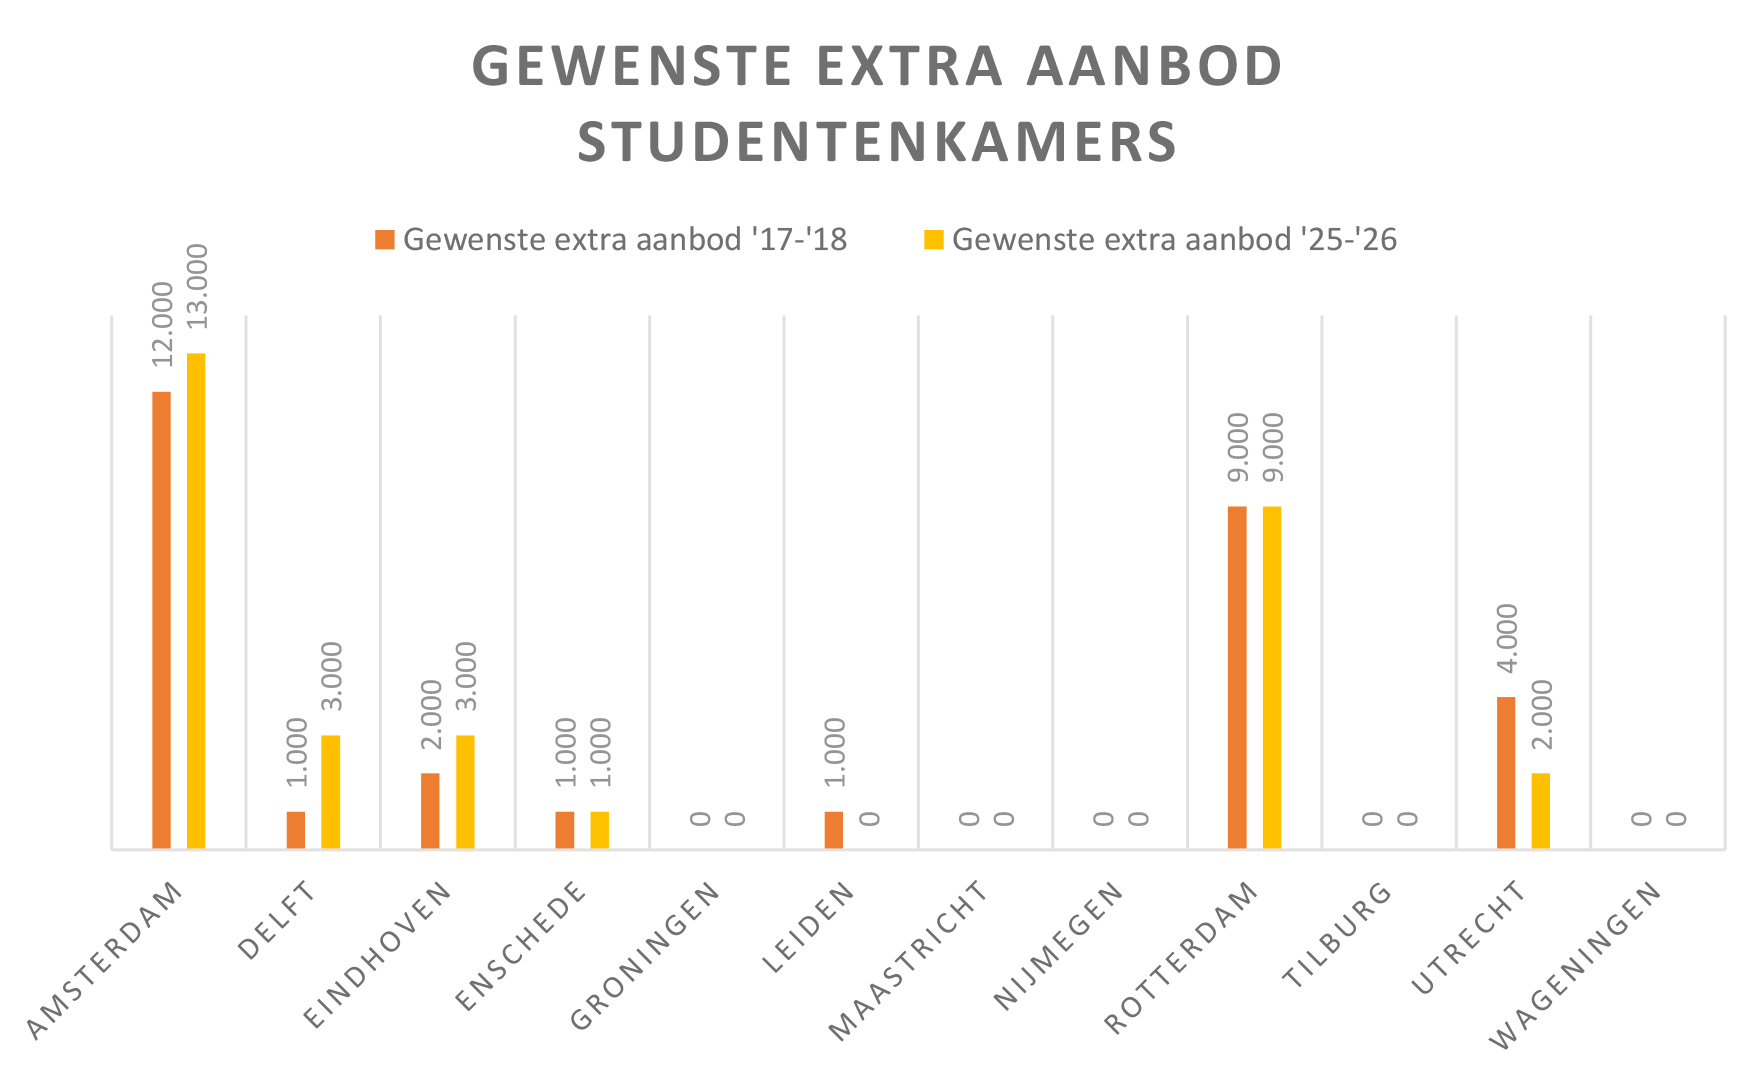
Desired additional availability ’17-‘18 vs Desired additional availability ’25-‘26’
The graph above shows for each university city how great the need for additional student housing units was in academic year ’17-’18, as well as the expected need in academic year ’25-’26. A zero listed for a city means the offer is equal to, or larger than, the need for more housing. Source: ABF report ‘Student housing’.
The graph above shows for each university city how great the need for additional student housing units was in academic year ’17-’18, as well as the expected need in academic year ’25-’26. A zero listed for a city means the offer is equal to, or larger than, the need for more housing. Source: ABF report ‘Student housing’.